Base map as an underlay: trace your network route over DXF, PDF or PNG
Quick answer
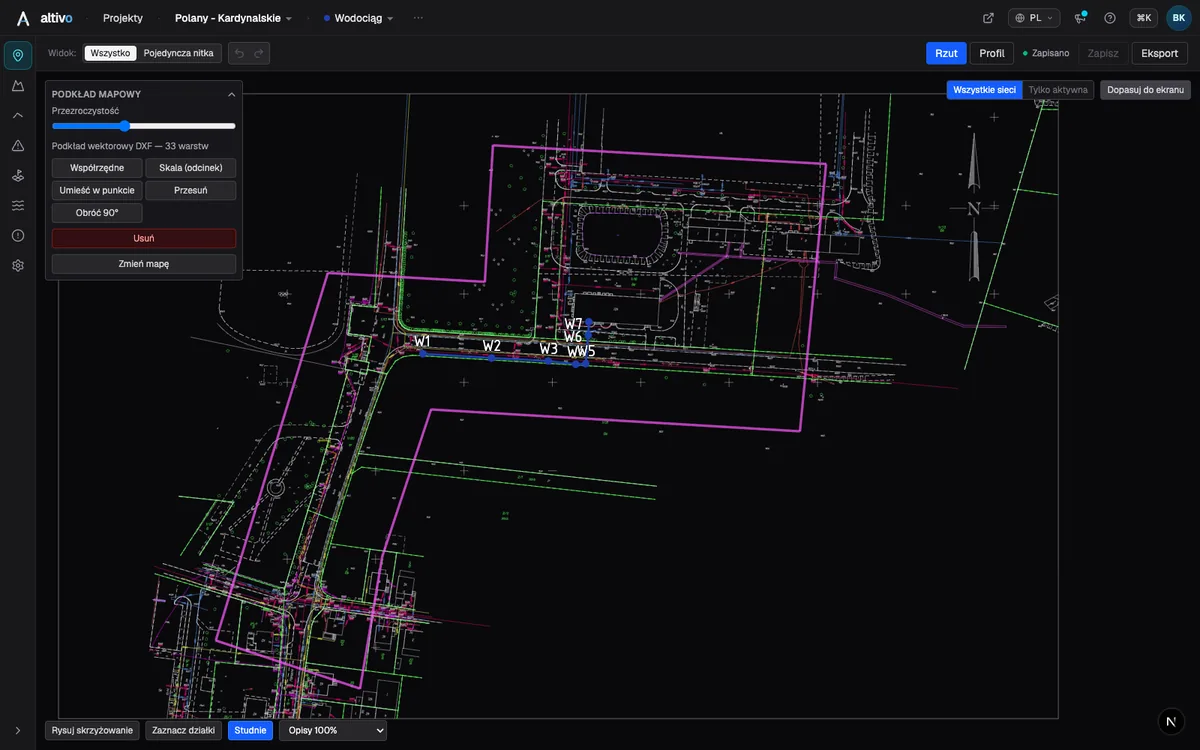
Load a survey drawing or base map into Altivo as a plan-view underlay: vector DXF (layers and colours preserved) or raster PNG, JPG or PDF. A DXF drawn in real-world coordinates usually lands in place straight away; a scan or PDF is calibrated with two points of known coordinates or one segment of known length. You then trace nodes over the map, and the long section is generated along that same alignment.
Every network design starts from a drawing: a topographic survey, a utility record drawing, a site plan issued with the brief. The traditional workflow has remained unchanged for decades — open it in CAD, draw the route over it, read off coordinates and chainages, retype them into a spreadsheet, and build the long section from the spreadsheet. In Altivo the map goes straight under the plan view: you trace the route with the mouse, and the plan and the long section read the same coordinates.
Two kinds of underlay — and when to use which
| Kind | Files | What it keeps | When to choose it |
|---|---|---|---|
| Vector | DXF (up to 24 MB) | original layers and colours, text, blocks with attributes, arcs, polylines | a drawing from the surveyor or a CAD export — sharp at any zoom |
| Raster | PNG, JPG, PDF (first page) | the image of the map as it is | a scan, a printout, a map extract from a portal, a photo of a drawing |
The rule of thumb: if a DXF exists, use the DXF. A vector underlay never goes blurry when you zoom, and a surveyor's drawing already in real-world coordinates usually needs no calibration at all — the geometry is already in metres and in the right place. Reach for a raster when a PDF or a scan is all you were given.
What a vector DXF underlay actually shows
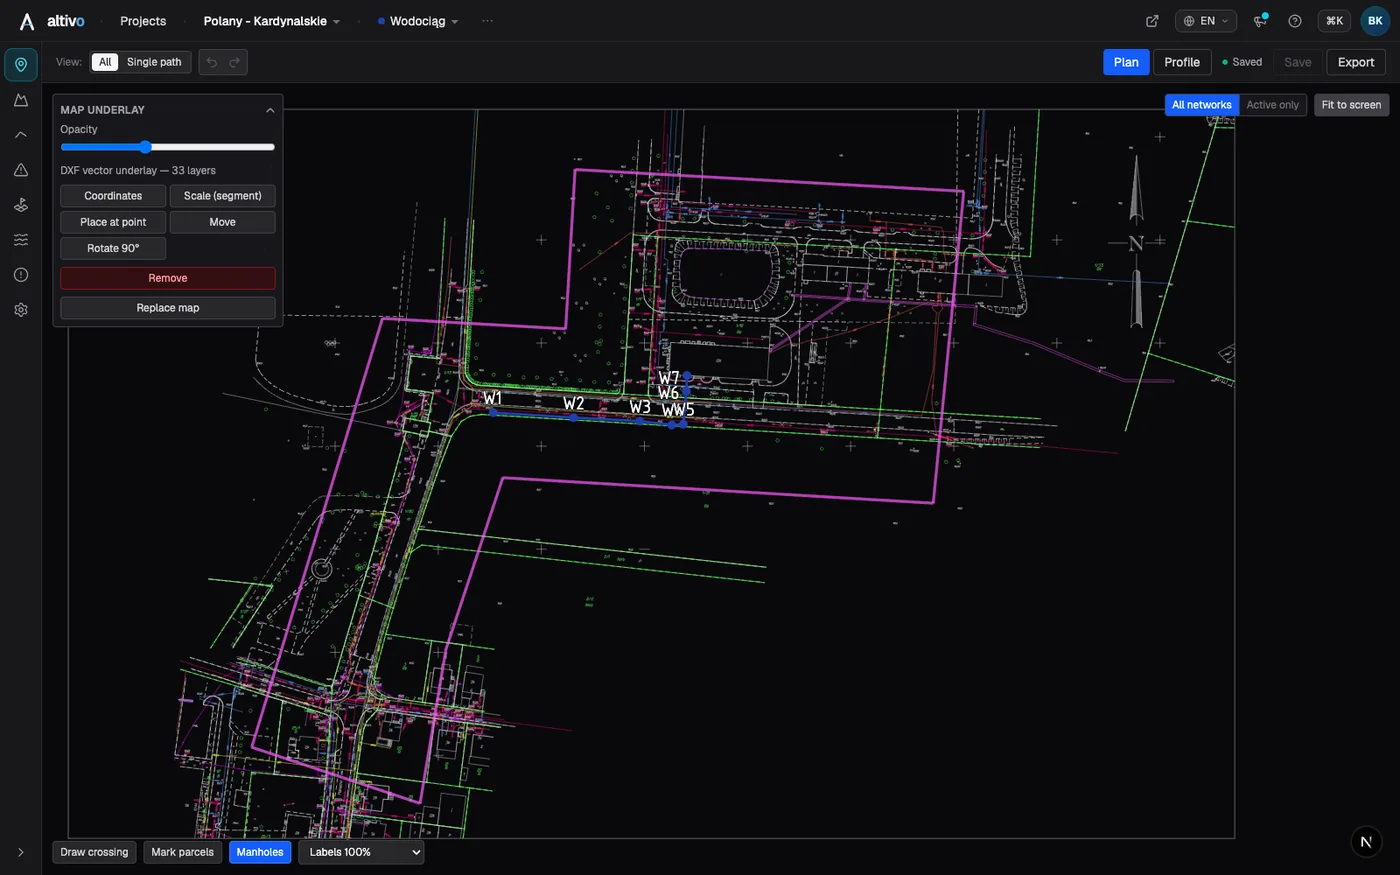
A loaded DXF is drawn with the structure of the original: layers with their assigned colours, TEXT and MTEXT, block attributes (ATTRIB — so manhole labels and plot numbers stay readable), arcs, circles and polylines. The panel reports the layer count, so you can tell at a glance whether the whole drawing came through. The limits are set so a browser copes with a typical survey drawing: 24 MB per file and 400,000 drawable elements. The parsed map is cached in the browser, so reopening the project shows it instantly instead of re-parsing.
What the underlay deliberately does not do: it is not exported. The DXF and the 3D IFC model contain your network; the map stays inside the app as drafting support. That is on purpose — the file you hand over should be the design, not a dozen megabytes of somebody else's drawing.
Calibrating a raster — two routes
A scan or an ordinary PDF carries no coordinate metadata, so after loading it you have to say where it sits and what scale it is at. Two buttons cover that.
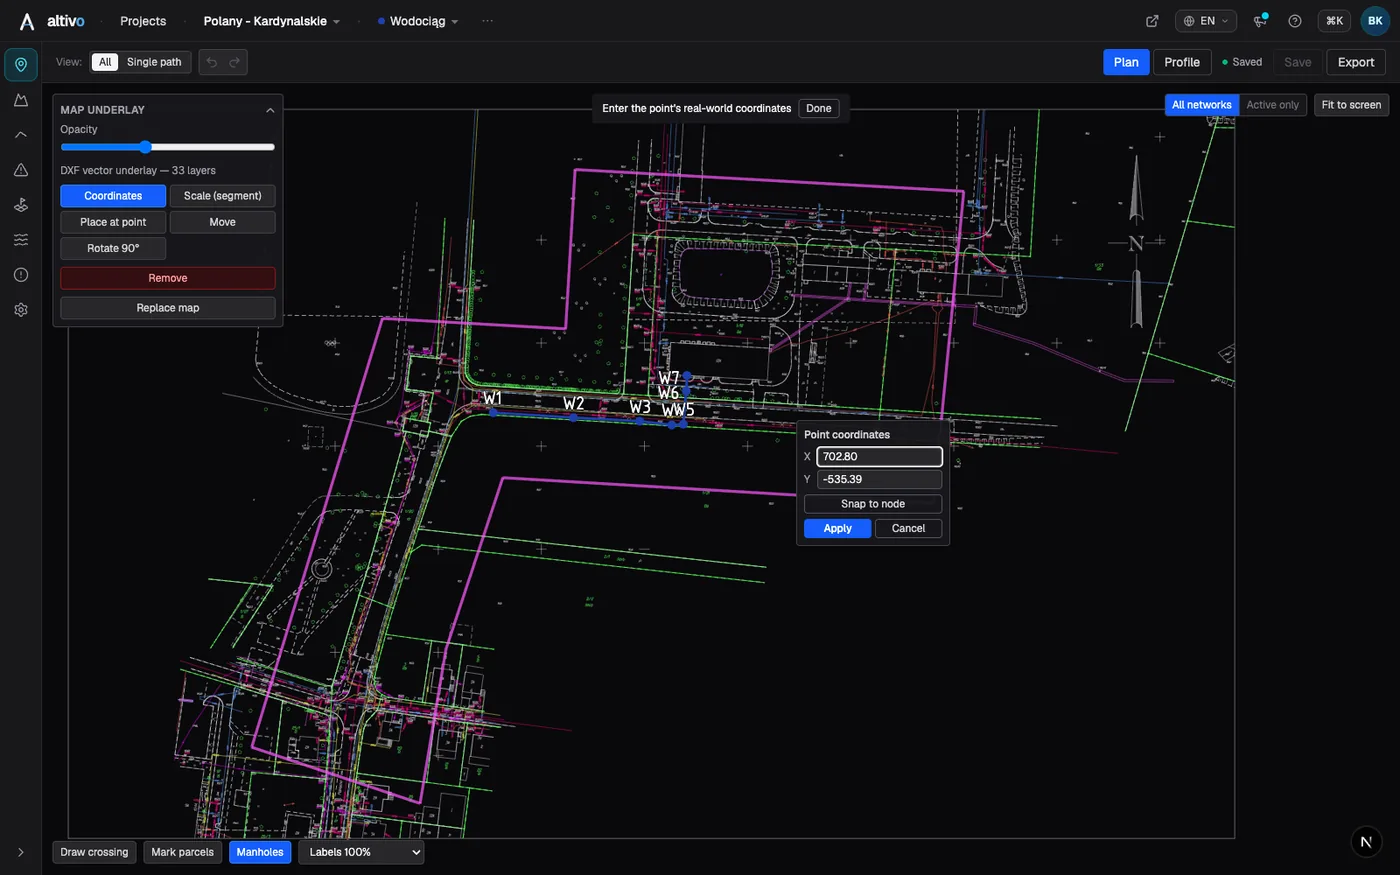
"Coordinates" — full calibration. Click a recognisable point on the map (a plot corner, a grid cross, an existing manhole) and type its real X and Y. If that point is already in the project as a node, you do not need to retype anything: "Snap to node" pulls the coordinates from the node you click. The first point moves the map into place; the second sets scale and rotation, after which the map sits in the project's coordinate system.
"Scale (segment)" — the quick route when the position is right but the scale is not. Click both ends of a segment whose real length you know (a building face, a manhole-to-manhole run, the drawing's scale bar) and type that length in metres.
Alongside those: the opacity slider (10–100%) dims the map so the designed network reads clearly against it; "Move" drags the underlay with the mouse; "Rotate 90°" straightens a map that came in sideways, turning it about its own centre without any calibration.
Step by step: from map to long section
1. Load the map. On the plan view open the "Map underlay" panel and click "Load map". A surveyor's DXF comes in with its layers; a PDF is rendered to a raster (first page).
2. Put it in place. A DXF already in real-world coordinates usually needs nothing further. Calibrate a raster with two points ("Coordinates") or a known segment ("Scale (segment)"). If the map landed off-screen, use "Place at point", then "Fit to screen".
3. Trace the route. Drop nodes over the map: along the carriageway centreline, along existing services, along plot boundaries. Every node gets coordinates immediately, so chainage computes itself. If you already have coordinates in a survey schedule, paste them instead — the map then works as a check that the route runs where it was meant to.
4. Read the crossings off the map. Existing services shown on the drawing are a ready-made list of utility crossings to enter — water, gas, cables, surface water. Enter each with its crossing level and the profile shows the required vertical clearances straight away.
5. Switch to the profile. Same route, same coordinates — the long section is built from what you traced, not from a separate spreadsheet. The DXF export (dual-scale profile, named layers, editable MText) and the 3D IFC export read the same data.
Common snags and what causes them
- The map loaded far away. Survey DXFs often carry national-grid coordinates in the hundreds of thousands or millions of metres, so an unassisted import can land outside the view. "Place at point" plus "Fit to screen" fixes it in two clicks.
- The map is sideways. If a scan or photo comes in landscape instead of portrait, use "Rotate 90°" — more than once if needed.
- The underlay drowns the network. Take the opacity down to 40–60%; on a dense record drawing that is the difference between a readable and an unreadable plan.
- No underlay panel. The network is in schematic mode — the underlay needs coordinate geometry.
- The raster scale is "nearly" right. Nearly is not enough: a 2% calibration error is a metre of ground error over 50 m of route. Calibrate with a segment of known length instead of eyeballing it.
Frequently asked questions
Which map files can I load as an underlay? Vector DXF up to 24 MB, plus PNG, JPG and PDF rasters. For a PDF, the first page is rendered at high resolution. Large scans are downscaled automatically, but long-and-thin maps keep high resolution along the long edge.
Does a DXF underlay keep the layers from the survey drawing? Yes — original layers and colours, TEXT and MTEXT, blocks with attributes, arcs and polylines. The panel reports the layer count, and being vector, the map stays sharp at any zoom.
How do I calibrate a scanned map to real coordinates? Two ways. "Coordinates": click a point and type its real X and Y (or take them from an existing node with "Snap to node") — the second such point sets scale and rotation. "Scale (segment)": click both ends of a segment of known length and type that length in metres.
Does the underlay end up in the DXF export? No. It is a tracing aid; the DXF and 3D IFC exports contain your network only.
The map loaded far away from my network — what now? "Place at point", then a click on the plan, moves the map corner there and switches to move mode. "Fit to screen" frames network and map together; "Rotate 90°" straightens a sideways map.
Does the underlay work with a schematic network? No — it needs coordinate geometry (nodes with real X and Y).
What it changes in practice
A map under the plan removes the most tedious step of all: shuttling coordinates between CAD and a spreadsheet. You trace the route where you can see it, and the plan and profile read the same numbers. And when the coordinates already come from a survey schedule, the map becomes the check that instantly shows the route running two metres off the footway.
See also: Plan and profile without Civil 3D, How to add crossings and objects, How to read a utility long section, Online long-section software with DXF export. Also useful: our free engineering tools.
Start a free trial — 14 days, no card required.
Related articles
Underground cable long section — power and telecom cable routes
How to draw the longitudinal profile of a buried power or telecom cable route: minimum burial depth by voltage class, crossings, protective ducting, warning tape and a DXF export — in the browser, no CAD.
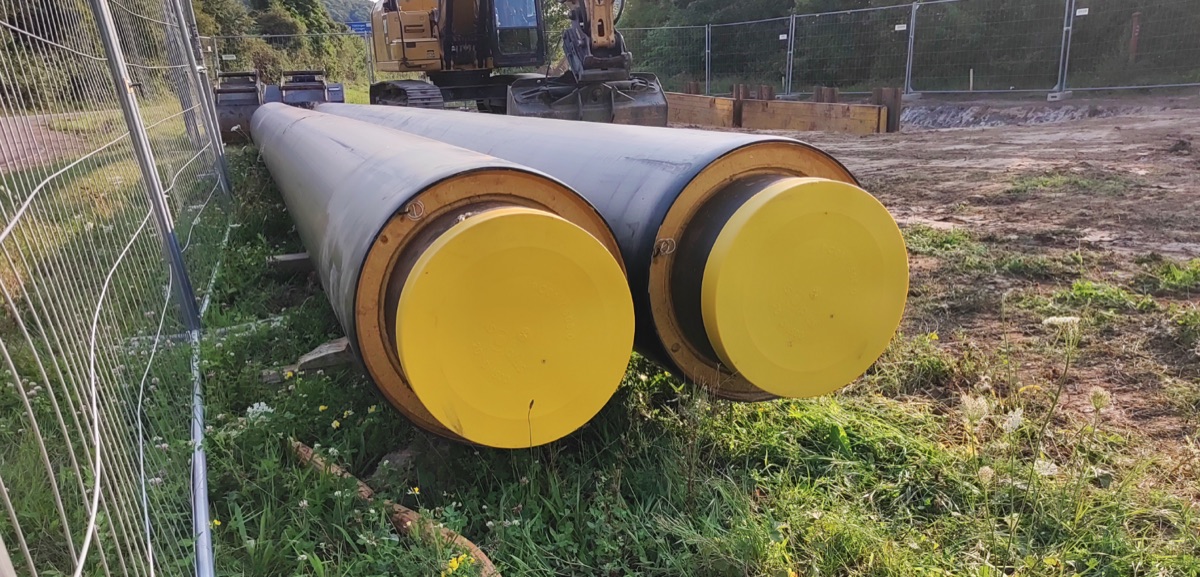
District heating long section — preinsulated pipe in profile
How to draw the longitudinal profile of a district heating network with preinsulated bonded pipe: two diameters (carrier and casing), cover to the casing crown, leak detection, crossings, the profile table and a DXF and IFC export — in the browser, no CAD.
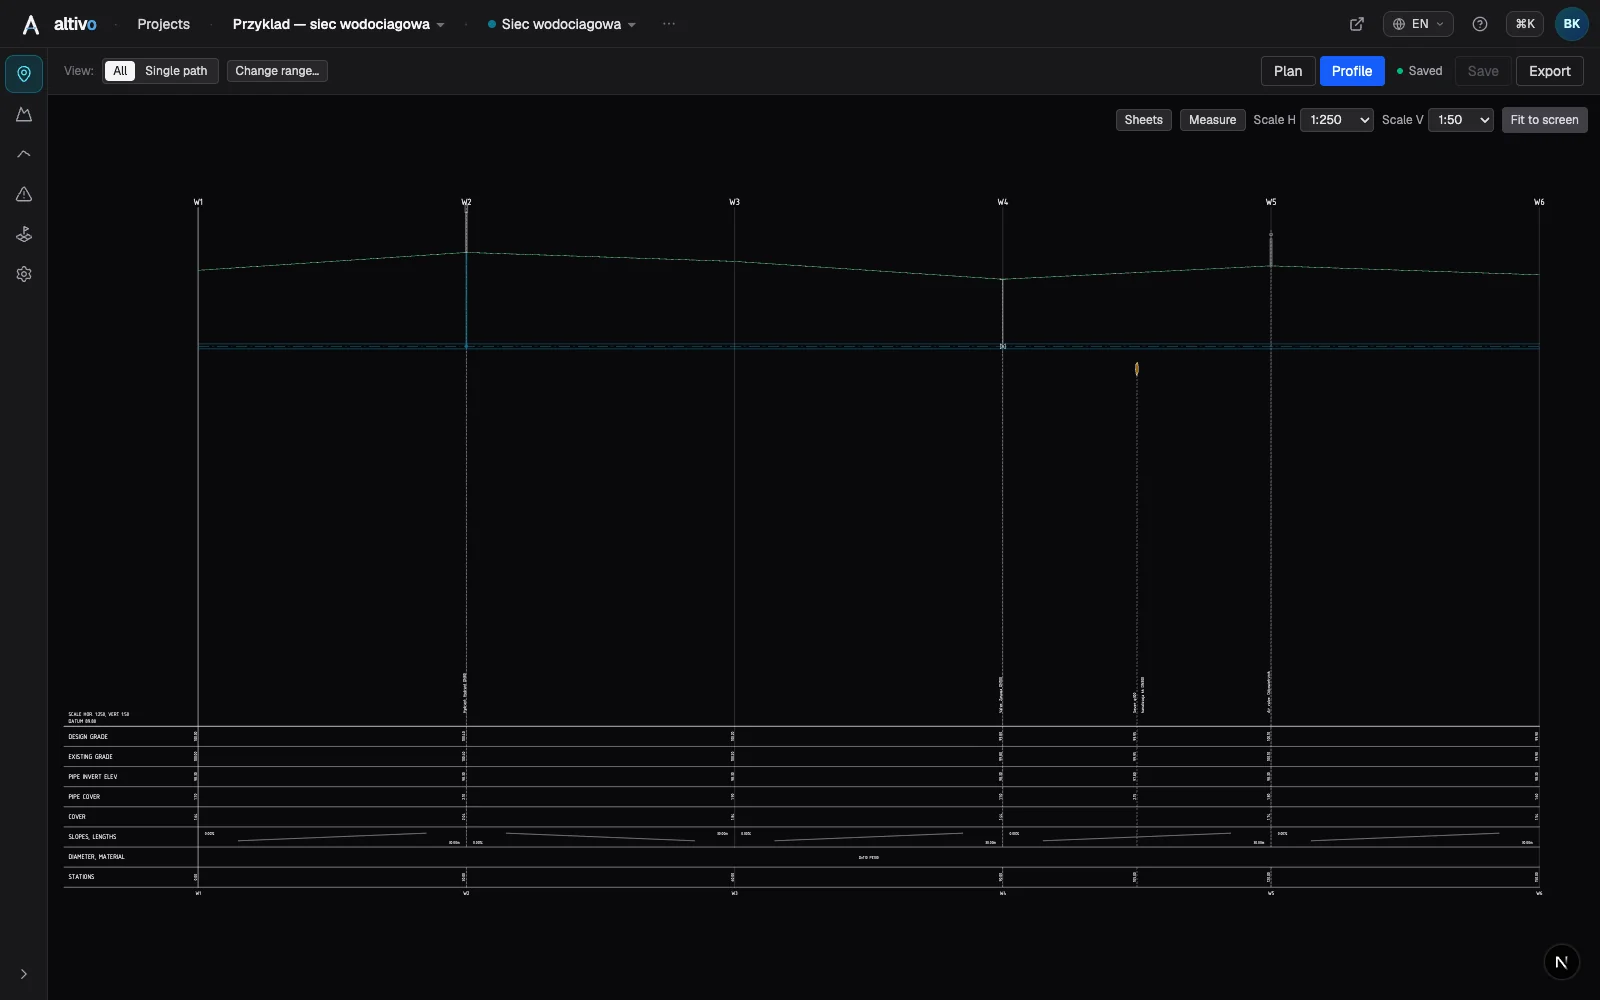
Water main long section to DXF — step by step
How to draw a water main longitudinal profile: minimum cover vs frost depth, pipe centreline levels, valves and hydrants, crossings, the profile table and a clean dual-scale DXF export — in the browser, no CAD.
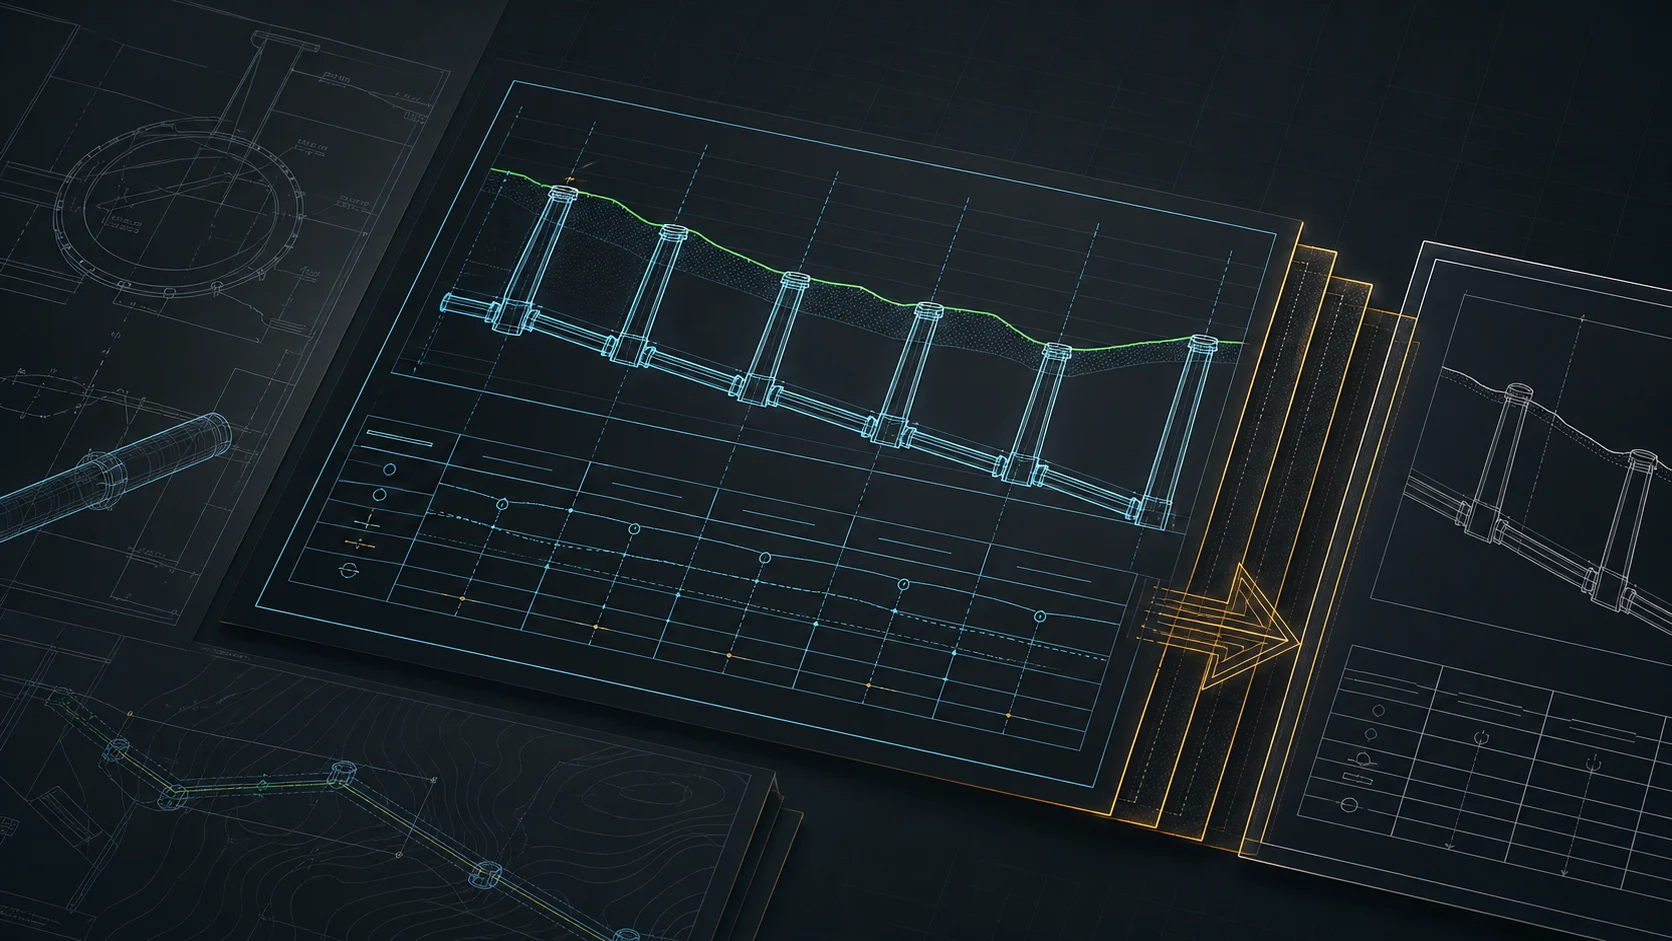
Sewer long section to DXF — step by step
From field coordinates to a CAD-ready longitudinal profile of a gravity sewer. A concrete walkthrough: import, gradients, manholes, drop connections, dual-scale DXF export.
Ready to design without the pain?
Altivo is the fastest way to produce a clean DXF. Try it today.
Start the 14-day trial